Costs
Unit economics and the choice of unit: why the wrong pick lies to you
Unit economics from the choice of unit onward: which costs a unit really caused, why blended figures mislead, and why payback is about cash and not profit.
Most unit economics arguments are settled before anyone reaches a number, because the two people arguing are not using the same unit. One means an order, the other means a customer, and both are calling it "the unit". Everything downstream inherits that confusion.
So this guide starts where the work actually starts: choosing the unit, then following the arithmetic from that unit up to the whole company, and being honest about which costs are allowed in and which are not.
What to take away
- The unit has to be a thing you can decide to make more of.
- What follows are definitions, not benchmarks.
- Acquisition cost is a fraction, and the fights are almost always about the denominator.
- An average across all channels, all segments, and all time periods will tell you your business is fine slightly before it stops being fine.
Choosing the unit
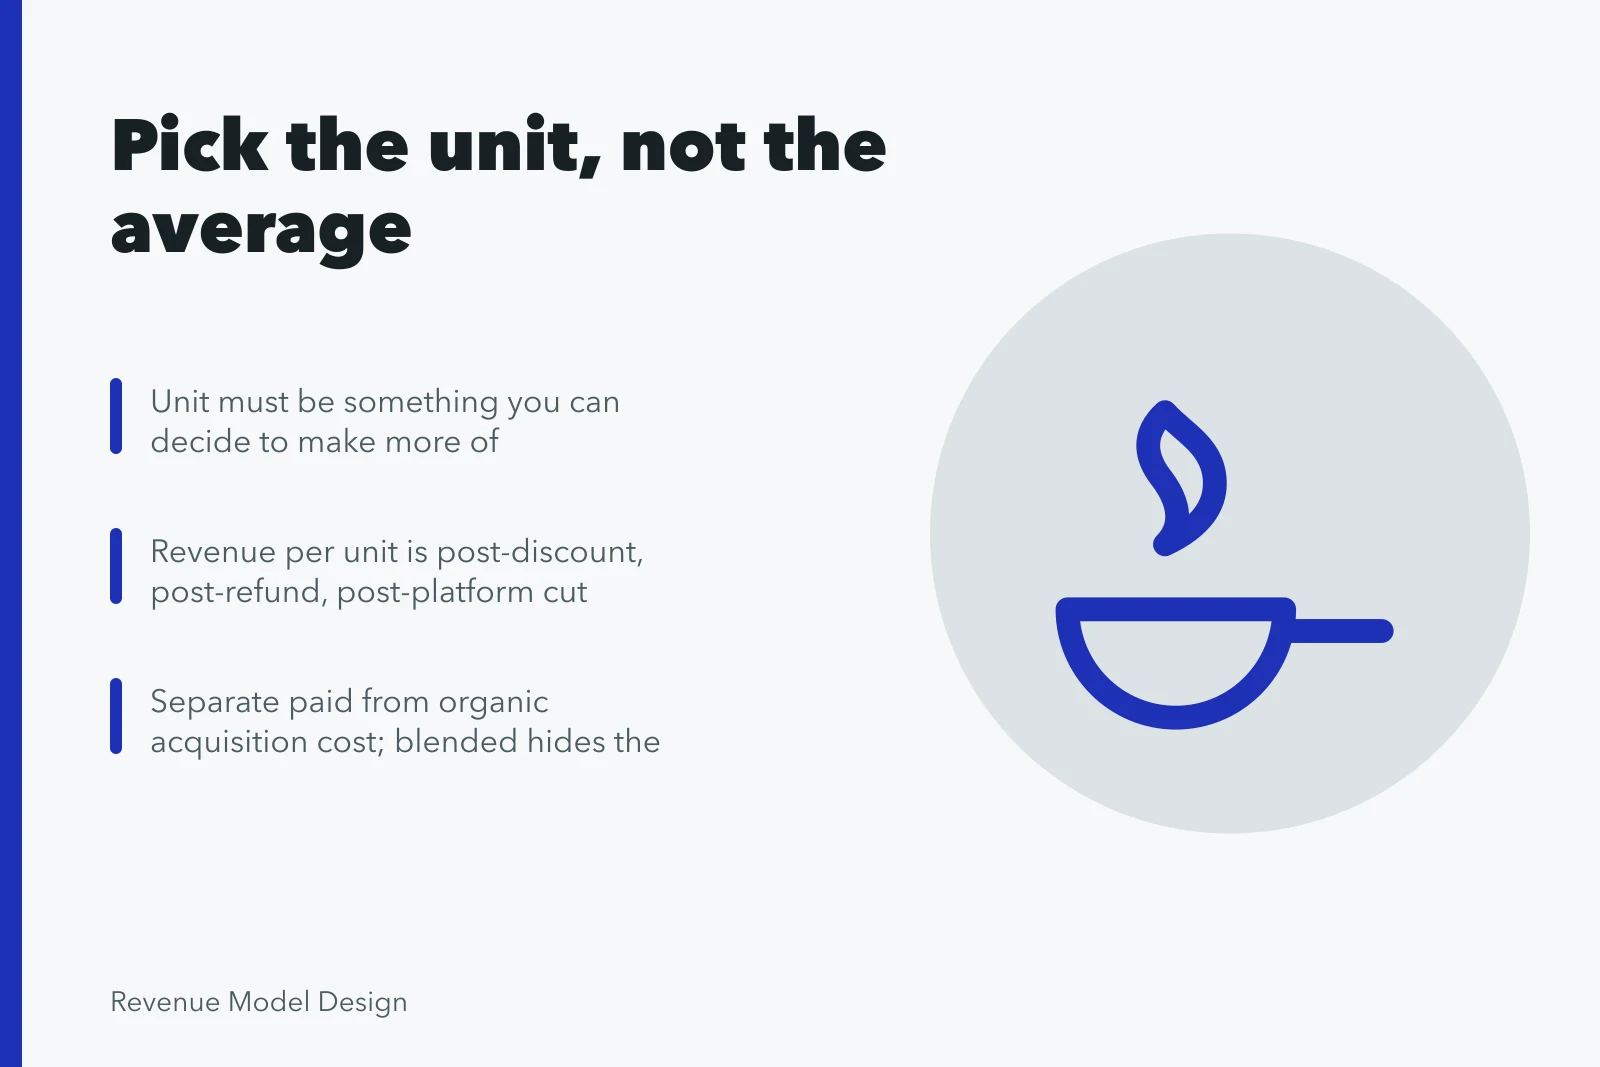
The unit has to be a thing you can decide to make more of. That is the whole test. If you cannot buy another one, it is not a unit: it is a category.
Three candidates cover most businesses, and they answer different questions.
One transaction. An order, a booking, a job, a delivery. This unit tells you whether the act of doing business is worth doing. It is the right unit when purchases are largely independent of each other, and the wrong one when today's sale mainly exists because of a relationship you paid for two years ago.
One customer. Everything a single buyer does with you across their whole relationship. This unit tells you whether acquiring people is worth the money. It is the right unit whenever repeat behavior is the point, and it is treacherous early, because you have to estimate the part of the relationship that has not happened yet.
One cohort. Every customer who arrived in the same period, followed forward together. This is the most honest unit and the slowest to produce, because it refuses to tell you anything about this month's customers until enough months have passed.
You will end up needing more than one. Keep them labeled, and note that which unit is even available to you follows from what triggers the money, which is the argument in revenue models. A great deal of confused reporting is one team's per-order number being compared against another team's per-customer number.
The chain
What follows are definitions, not benchmarks. The definitions are fixed; every value in them belongs to you and to nobody else.
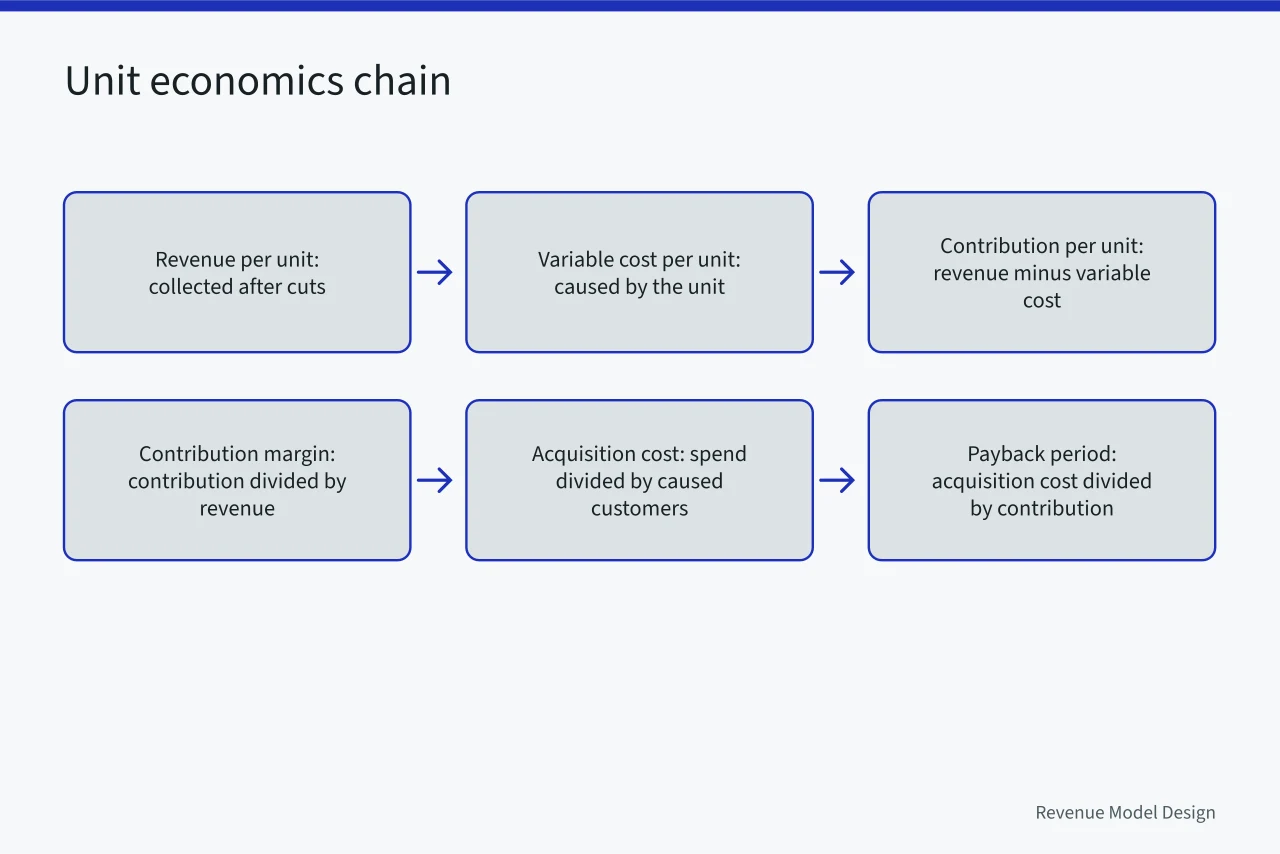
Revenue per unit is what you actually collected, after discounts, refunds, chargebacks, and the share that goes to a channel or a platform. List price is not revenue. If a marketplace, an app store, or a distributor takes a cut before you see the money, that cut never belonged to you. The structure that produced the list price in the first place is the subject of pricing architecture.
Variable cost per unit is everything that would not have been spent if that unit had not existed. Not "costs related to delivery": costs caused by the unit.
Contribution per unit is revenue per unit minus variable cost per unit. This is the money each additional unit hands you to cover everything that does not scale with volume.
Contribution margin is contribution per unit divided by revenue per unit. Expressing it as a ratio is useful for comparing across products and dangerous for planning, because rent is paid in currency, not in percentages.
Acquisition cost is everything spent to cause a customer to arrive, divided by the number of customers who arrived because of it. The second half of that sentence is where the argument lives, and it gets its own section below.
Payback period is acquisition cost divided by contribution per period. It answers one question: how long your money is someone else's before it comes back.
Lifetime contribution is contribution per period multiplied by how many periods the relationship lasts, minus the cost of keeping it alive. Note what it is not: it is not lifetime revenue, and the difference between those two is exactly the mistake that makes a doomed business look fundable.
The company-level identity makes the trade-off visible: total contribution minus costs that do not move with volume is your operating result. Three things change it: more units, more contribution per unit, or fewer fixed costs.
Every strategy is one of those three in disguise. What is reachable depends on the shape of the business, settled by the five decisions under every model.
The four arguments about variable cost
Almost every disagreement about unit economics is one of these.
Support. If a customer's questions arrive because they bought, support is caused by the unit. The usual objection is that the support team is salaried and would be paid anyway, which is true this month and false over any horizon where you hire. Treat it as variable and you will notice when a product line is quietly consuming your team.
Payment and platform fees. Always variable, always caused by the unit, frequently left out because they are deducted before the money lands and never appear as an expense anyone approves.
Infrastructure. The part that scales with usage is variable. The part that exists whether or not anyone shows up is not. Splitting these is tedious and it is the difference between knowing your margin and guessing it. The division between a cost that moves with output and one that does not is the first one made in MIT's financial and managerial accounting course.
Returns, refunds, and failed deliveries. These belong in the unit even though they attach to a different unit than the one that generated the revenue. A business that ignores them is measuring its successes and expensing its failures somewhere else.
The rule that resolves all four: ask what would have been spent if this unit had never happened. Everything else is arithmetic.
What counts as an acquired customer
Acquisition cost is a fraction, and the fights are almost always about the denominator.
Count only customers the spending caused, not people who would have arrived anyway. They come through word of mouth, an existing relationship, or a brand built years ago. Adding them to the bottom of the fraction makes paid acquisition look cheap.
The honest version separates paid from organic, computes them apart, and accepts the paid number will be larger and more useful than the blended one.
The numerator has its own trap. Media spend is acquisition cost, and so are the salaries of the people who run it, their tools, the commission on a closed deal, the free trial's delivery cost, and the discount used to close.
Count only the ad invoice and acquisition looks cheap. The bank account will disagree.
Blended numbers hide the thing you need to see
An average across all channels, all segments, and all time periods will tell you your business is fine slightly before it stops being fine.
Three ways this happens. Channel mix moves: a cheap channel saturates, so spend shifts to an expensive one, and the blended figure moves smoothly while the marginal figure jumps.
Segment mix moves: one segment with strong economics subsidizes another with weak ones, and aggregate says nothing about either. cohort age: your newest customers have had least time to churn, and a blended retention figure flatters you in proportion to how fast you grow.
The correction is not sophisticated. Cut every number by acquisition channel and by arrival cohort, and look at the newest cohort separately. If the last three cohorts look worse than the ones before them, that is the only number in the report that is about the future.
Payback is a statement about cash, not about profit
A short payback period does not mean a customer is profitable. It means you get your money back quickly and can spend it again. A long payback does not mean a customer is unprofitable. It means you must finance the gap.
That distinction decides how you grow. If payback is long, every new customer consumes cash you have to hold, borrow, or raise, and growth accelerates the drain. Businesses do not usually fail because their unit economics were negative. They fail because their unit economics were positive and slow, and they grew faster than their balance sheet could carry.
So compute payback against contribution, not revenue, and hold it beside a simple cash question: at your current growth rate, what is the largest cumulative gap between money out and money back, and can you cover it without new funding?
The costs that change shape when you scale
Two failures of the standard model, both worth checking directly.
Costs that look variable are often step functions. Warehouse space, support headcount, a server tier, a license band: flat across a wide range, then a jump. Model them as smooth per-unit costs and you will price beneath a step you are about to hit.
Costs that look fixed are often variable in disguise. Compliance work that grows with customer count, account management that grows with account size, and the internal coordination cost of a widening product line all move with volume even though they arrive as salaries.
The practical version: recompute your unit economics at two or three times your current volume, using the cost structure you would actually need at that volume rather than the one you have. If the answer improves, say why. "Scale" is not a reason; a specific cost that stops growing is.
Building your own
An order of operations that avoids most of the rework.

| Step | What you produce | The thing that usually goes wrong |
|---|---|---|
| 1 | A written definition of the unit | Two teams keep separate definitions and never compare them |
| 2 | A revenue line net of discounts, refunds, and channel cuts | List price is used instead of collected revenue |
| 3 | A variable cost list, each line justified by the caused-by test | Costs are grouped by department rather than by cause |
| 4 | Contribution per unit | The subtraction is done against revenue that was never received |
| 5 | Acquisition cost split by channel, paid separately from organic | Organic customers are used to dilute paid spend |
| 6 | A cohort table by arrival period | Everything is averaged, and the newest cohort disappears |
| 7 | Payback, and the cumulative cash gap it implies | Payback is computed on revenue rather than contribution |
| 8 | A restatement at a materially larger volume | Step costs are modeled as smooth ones |
Keep the whole thing in one place, keep the definitions written down next to the values, and date it. Six months from now the value will have changed and the definition should not have.
Three questions this answers, and one it does not
Unit economics tells you whether an additional unit is worth producing, how long your money is tied up before it returns, and which of your segments is paying for which. Those are real answers and they are worth the work.
It does not tell you whether to build the business. Weak unit economics today may have a clear path to strong ones: costs falling with volume, prices rising with proof, channels getting cheaper with brand.
Strong unit economics today may have no path to enough units, but the arithmetic bounds the argument; it does not replace it.
Where to look things up
Every figure here is deliberately absent. A unit economics number copied from elsewhere is worse than none: it carries someone else's cost structure, customer mix, and definitions, and it arrives with the authority of a fact.
If you need a structured place to record the assumptions behind your own figures, the U.S. Small Business Administration's business plan guidance sets out the financial sections an outside reader will expect, which is a reasonable discipline even when nobody outside is reading.
Bottom line
Define the unit, subtract only the costs that unit caused, split by channel and by cohort, and check what happens to the whole thing at a volume you have not reached yet. Do that and the numbers will be small, specific, and yours. That is worth more than a large number that belongs to somebody else's company.
Common questions
Which unit should we start with?
The one you can decide to make one more of, and if two candidates pass that test, use both and label them. What you must never do is compare a figure computed on one against a figure computed on the other.
How do we handle a cost that is half caused by the unit?
Split it if you can defend the split, and mark it as an allocation if you cannot. What matters is that a later reader can see which part of the answer is measurement and which part is convention.
Is a negative contribution always fatal?
No, but it has to be temporary by design rather than by hope. Name the cost that will fall, the volume at which it falls, and the date by which you will know. Without those three, it is a plan to lose money at scale.
How often should the model be recomputed?
Monthly for most businesses, and always with the newest cohort shown separately. The newest cohort is the only part of the report that is about the future.
In this guide
- Where unit economics mistakes actually hide: inputs, not arithmeticNine unit economics mistakes that are bookkeeping rather than concept, grouped by whether they enter through the inputs, the arithmetic, or the use.
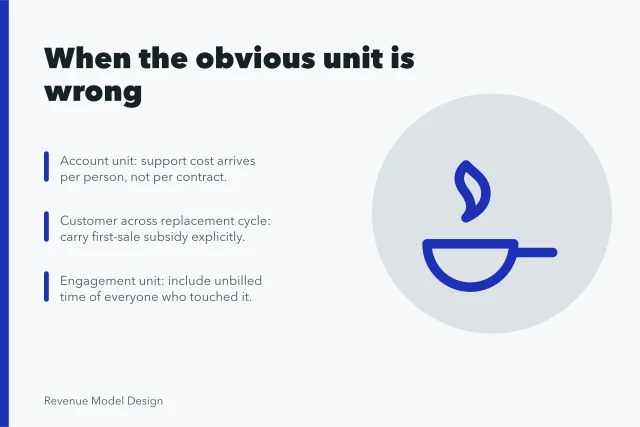
- Unit economics examples: when the obvious unit is the wrong oneTwelve unit economics examples where the obvious unit is the wrong one, with the unit that works and the cost that has to follow it for the answer to mean anything.
- Why most unit economics tools fail the spend-to-cost joinBest unit economics tools 2027, ranked by how well each joins spend, accounts and costs, and what to test in a vendor trial before you buy one.