Maintenance
Part of Getting service models right the first time
Quoted rate vs collected rate: the service models metrics that matter
Quoted rate and collected rate tell different stories. Track the four leaks, the senior-hour ceiling and client concentration to see where margin goes.
A firm can hold its published rate for years while the money it collects per hour falls the whole time. The price list never changes. The gap opens between the rate quoted and the cash that arrives, and almost no dashboard shows it.
Every figure below is invented to make the arithmetic visible. Substitute your own.
What to take away
- The quoted rate is a claim. The effective rate is what a period of work actually earned per hour, and it is the only one of the two you can spend.
- Between recorded time and collected cash sit four separate leaks. Measure them one at a time or you will fix the wrong one.
- Capacity is set by the calendars of the people a client insists on, not by headcount.
- A single realization percentage says the number moved, never which of the four steps moved.
- A low realization can be deliberate. The metric cannot tell a strategic discount from lost scope, so the engagement note has to.
Quoted rate against effective rate
Take a fixed fee built on a hundred hours at a quoted 200 a unit, so 20,000. Divide the fee by the hours actually spent:
| Hours actually worked | Effective rate | Share of quoted |
|---|
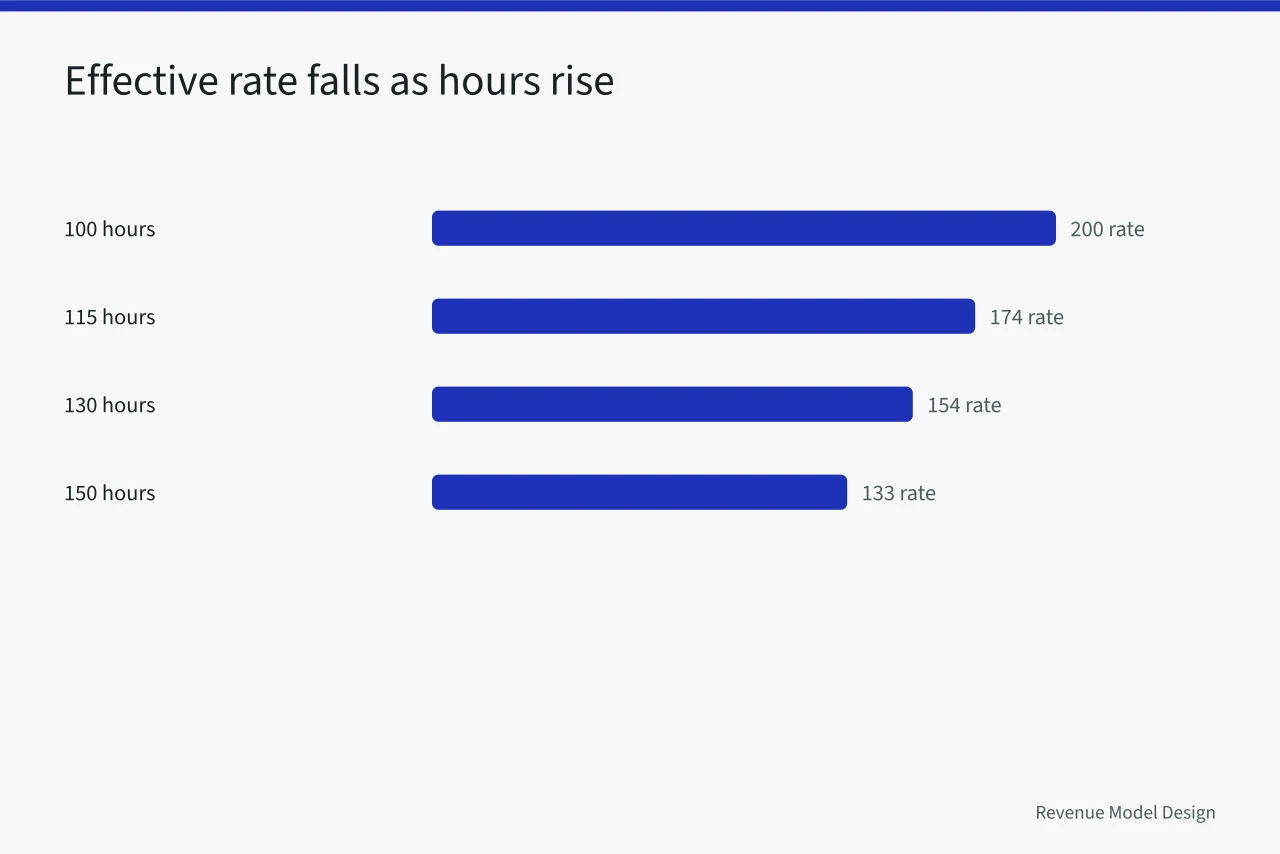
Fifty percent over the estimate costs a third of the rate. Nobody discounted anything, so the firm is working for less. The invoice still reads 20,000, so the loss never appears as a loss.
Track the effective rate per engagement, not per client. A client average hides the engagement that ate the year, the same way the unit economics chain hides a bad contract inside a good account.
The four leaks, in order
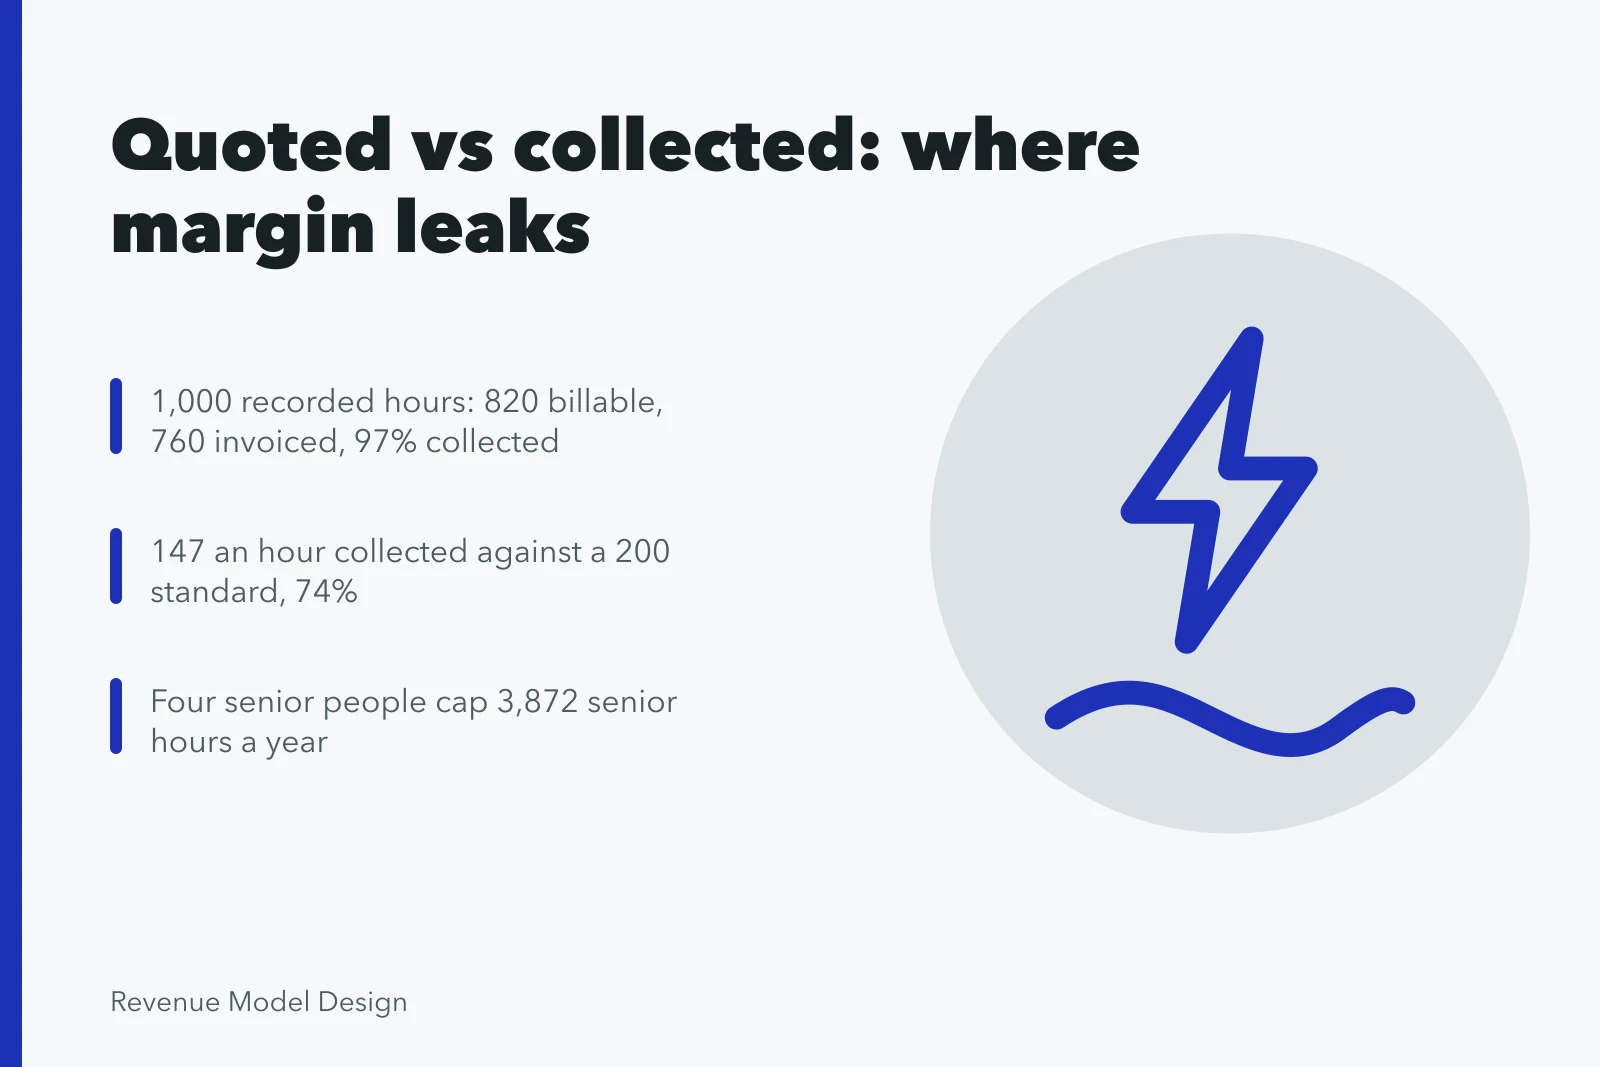
Time and materials work loses value in four places. On an invented month of 1,000 recorded hours at a standard 200:
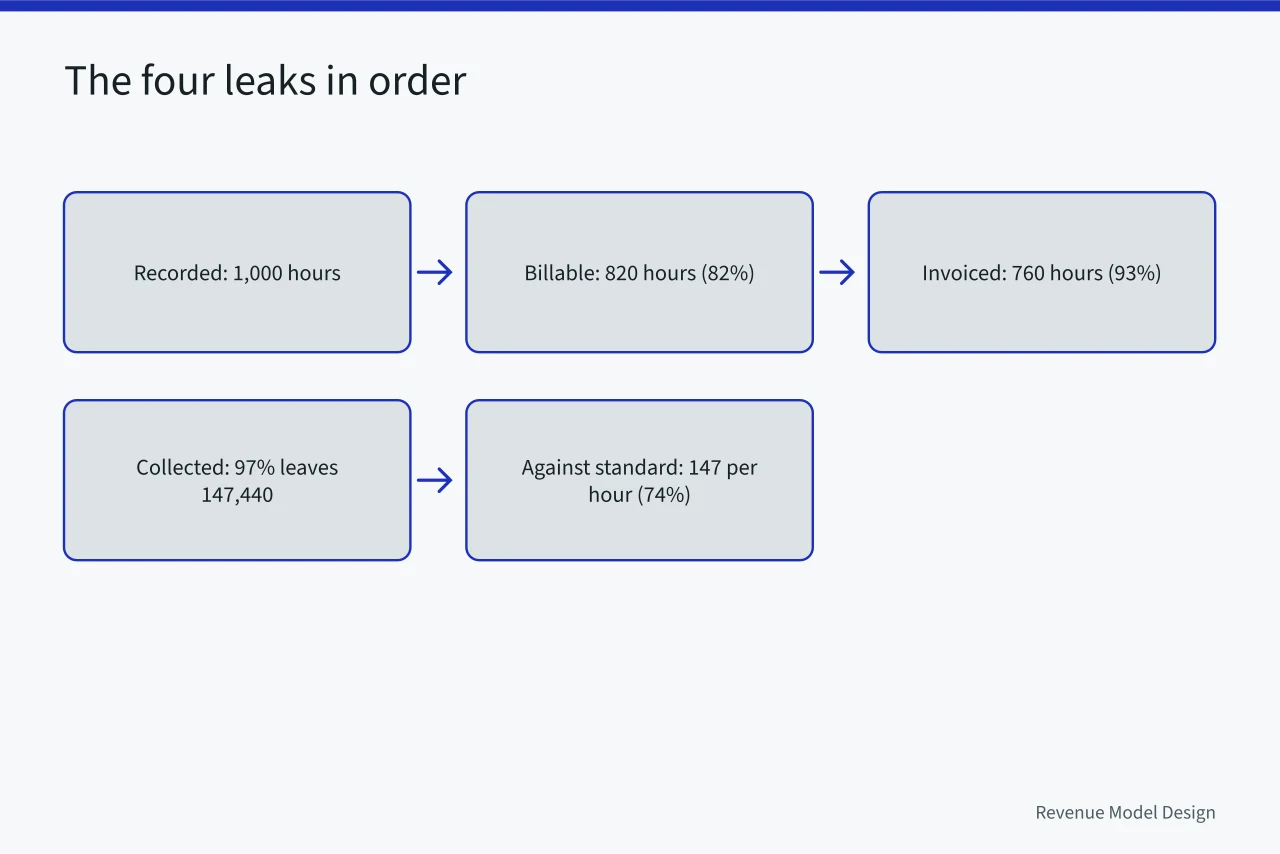
Each step has a different owner and a different fix. Step one is scoping and staffing. Step two is a partner discounting to end an argument. Step three is collections. A single realization percentage says the number moved without saying which step moved.
Managerial accounting draws the same line between a recorded cost and an assigned one. MIT's financial and managerial accounting course works through why the two diverge.
The senior-hour ceiling
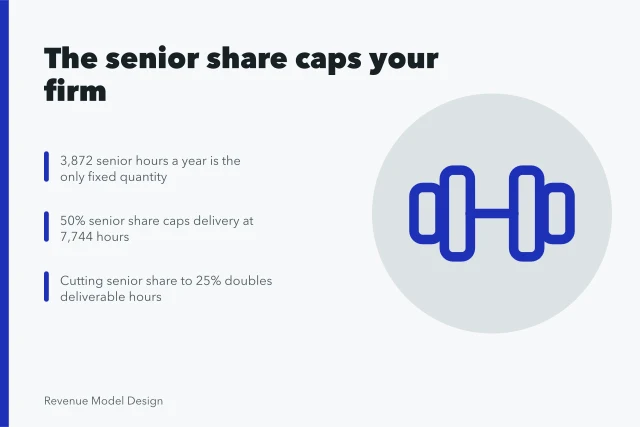
Say four senior people each have 44 working weeks and 22 hours a week that can go to client work after selling, hiring and running the firm. That is 3,872 senior hours a year, and it is the hard number in the business.
Show the numbers
| 50% | 7,744 |
|---|---|
| 35% | 11,063 |
| 25% | 15,488 |
| 15% | 25,813 |
Nothing in that table is about selling harder. Moving from half to fifteen percent multiplies capacity by more than three. The only way to move it is to make more work deliverable by people not on that list of four. That is a documentation, training and method problem, and it is slow.
Report monthly the share of delivered hours that required a senior name. It is the one number that says whether the ceiling is rising. What the ceiling does to the shape of the whole business is covered in service models.
Concentration
Take a book of ten clients at these percentages:
- 30
- 18
- 12
- 10
- 8
- 7
- 5
- 4
- 3
- 3
The largest is 30%, the top three are 60%, the top five 78%. Lose the largest and you keep 70%, needing 43% growth across everyone else to get back.
Report the top-one and top-three shares beside revenue every month. Concentration also moves pricing out of your hands: charging different buyers different prices for the same work is a commercial choice with legal edges, and the federal price discrimination statute is where those edges are written down.
A growing firm with rising concentration is more fragile than it was a year ago, and revenue growth alone will never say so. The same reading applies to any book where a few payers dominate, which is why it also appears in the revenue models measures.
Two things these numbers will not tell you
They will not tell you whether your rate is right. The effective rate says what you collected, not what the work was worth to the buyer. Those are different questions, taken up in pricing architecture.
They will not tell you whether an engagement was good. A job at 70% realization that produced a reference and a repeat client may be the best work you did that year. Write the exception beside the number rather than adjusting the number.
Common questions
Should the effective rate be computed before or after non-billable time?
Both, labeled. Fee divided by charged hours tells you whether the estimate held. Fee divided by every hour the firm spent, including the pitch and the rework, tells you what the engagement earned. Firms usually publish the first and manage on the second.
Our people do not record time. Can we measure any of this?
Partly. You can compute a fee against a rough hour estimate per engagement, and you can count how many engagements needed a senior person. Both are cruder than a timesheet and both beat nothing. What you cannot do is claim precision you did not collect.
Is a falling effective rate always bad?
No. It falls on purpose when you take a strategic job cheap, and by accident when scope is not controlled. The metric cannot separate those. The engagement note can, which is why the note has to exist.
How often should these be reviewed?
Monthly for the leaks and concentration, because both move. The senior-hour ceiling moves over quarters, and reading it monthly invites conclusions from noise.