Costs
Part of Unit economics and the choice of unit: why the wrong pick lies to you
Why most unit economics tools fail the spend-to-cost join
Best unit economics tools 2027, ranked by how well each joins spend, accounts and costs, and what to test in a vendor trial before you buy one.
What to take away
Unit economics is hard because the numbers live in five systems that disagree about what a customer is. Ad spend sits in one, arrivals in another, invoices in a third, delivery costs in a fourth, accounts in a fifth. None share an identifier.
The tooling question is a data question first. Solve the join and the arithmetic is a spreadsheet. Skip it and no software produces a number you can defend.
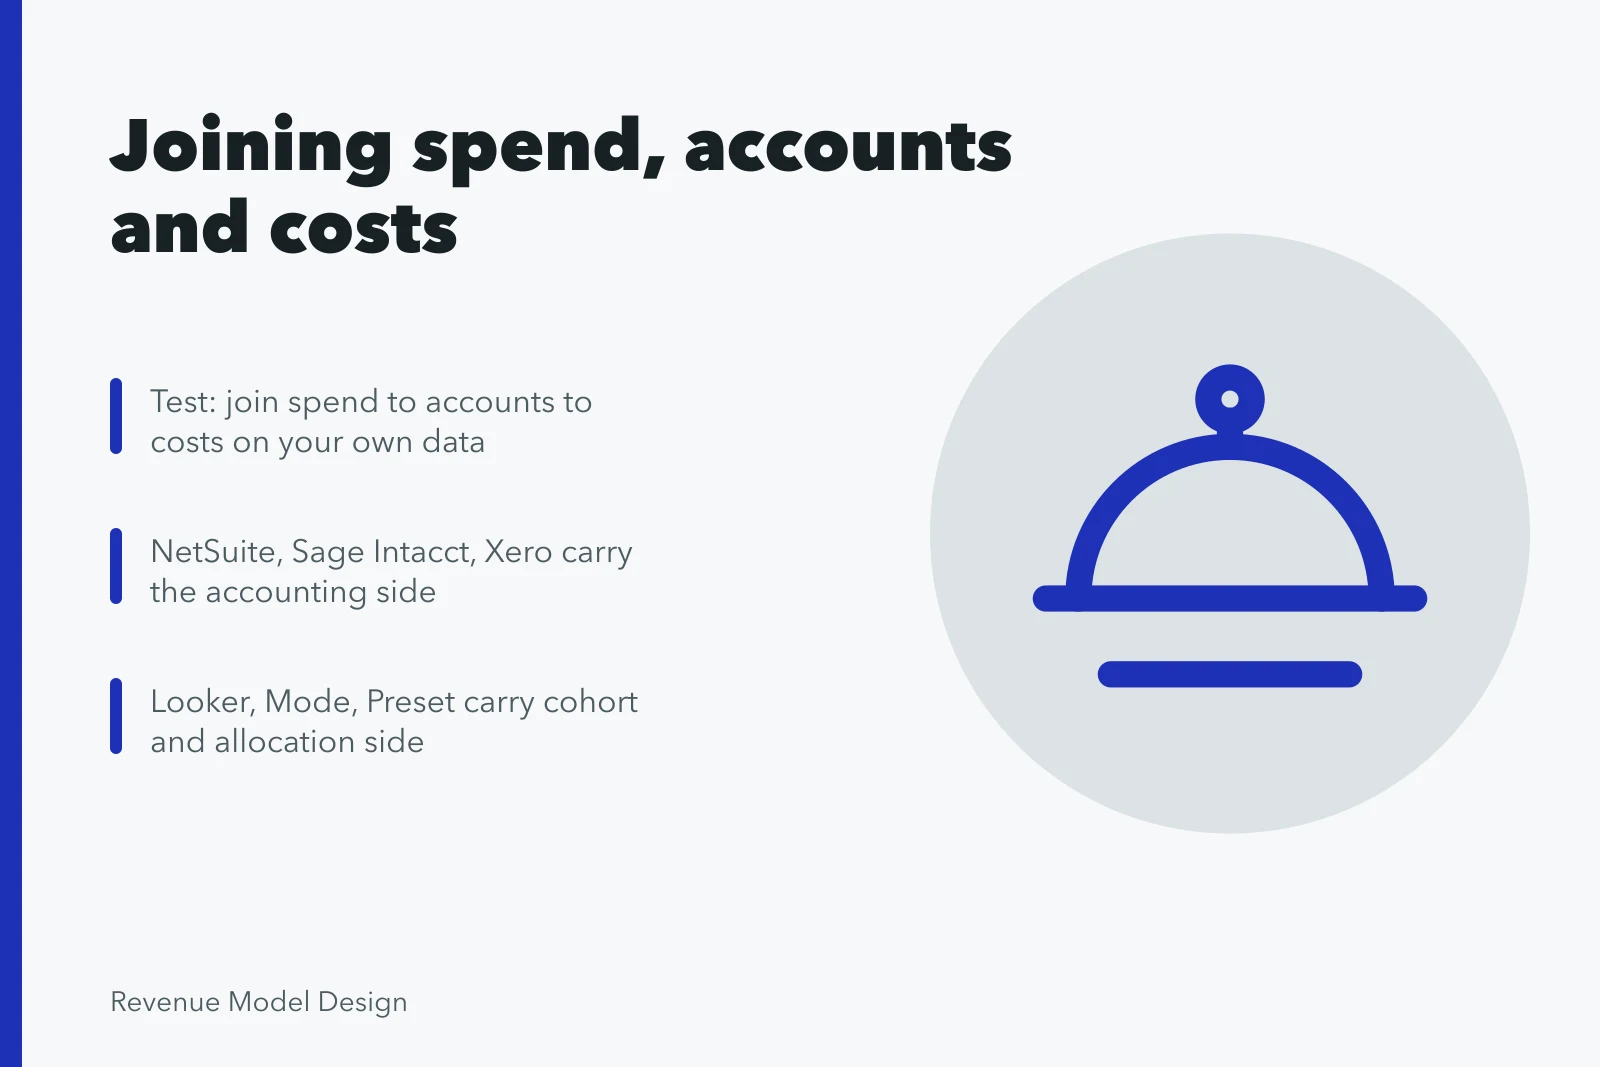
- Rank any unit economics tool by one test: can it join spend to accounts to costs on your own data, in an evaluation, not on a sample?
- NetSuite, Sage Intacct and Xero carry the accounting side. Looker, Mode and Preset carry the cohort and allocation side. Few tools do both well.
- A dashboard reports aggregates. Unit economics is a cohort and allocation question, which is why the dashboard usually cannot answer it.
- Keep every assumption in the file, dated, next to the numbers it produced.
- No tool reconstructs arrival dates you never stored. Start storing them today.
The five-link spend-to-cost join
Five links have to hold before any tool can produce a defensible number.
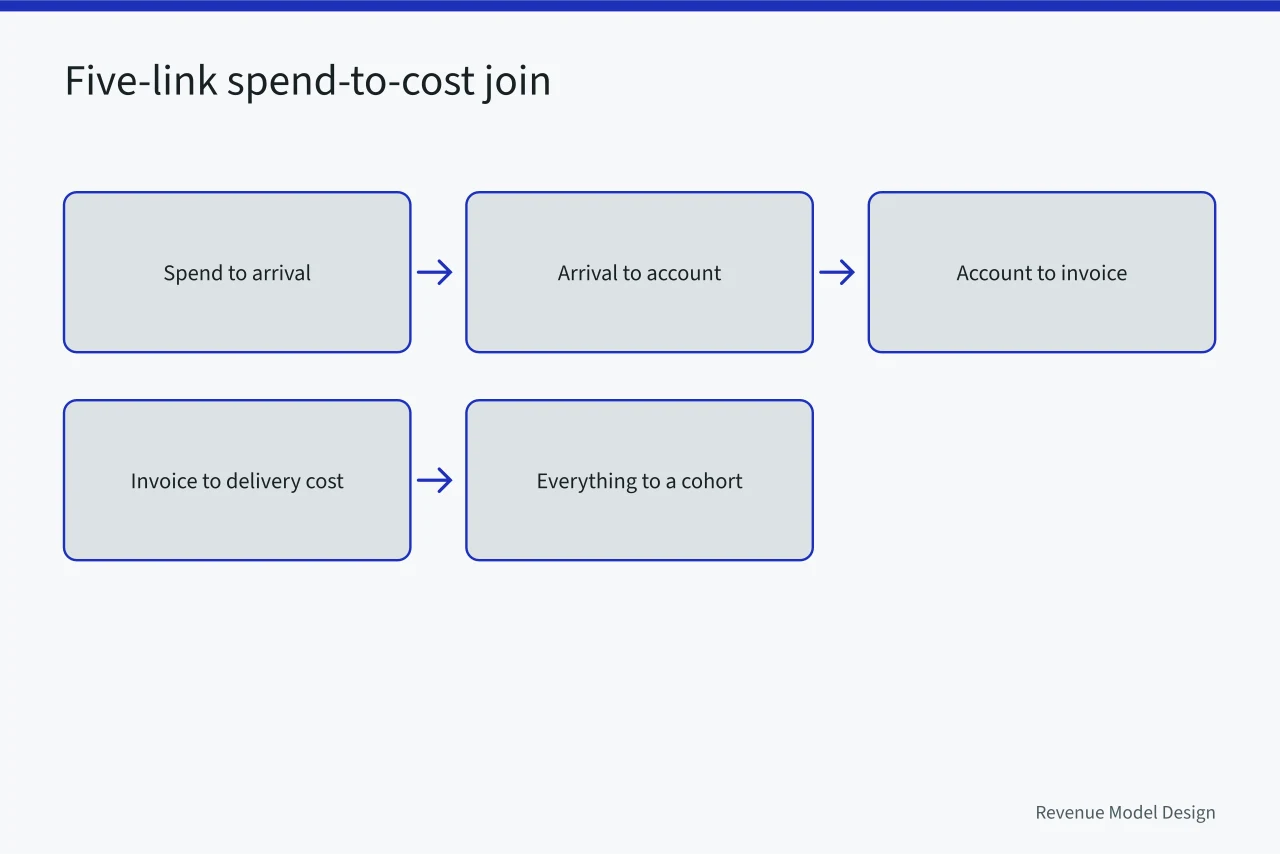
| Link | What it connects | Where it usually breaks |
|---|---|---|
| Spend to arrival | Acquisition money to the people who arrived | Channel reporting counts arrivals its own way |
| Arrival to account | The visitor to the account created | Signup identity differs from billing identity |
| Account to invoice | The account to what was billed and collected | One paying entity holding several accounts |
| Invoice to delivery cost | Revenue to what serving that customer consumed | Costs recorded by department, not by customer |
| Everything to a cohort | Each record to the period the customer arrived | Arrival date not stored, or overwritten on renewal |
The last row cannot be fixed retrospectively. If arrival dates were never recorded, a cohort view of your history does not exist and no tool reconstructs it.
The fourth row is the one people underestimate. Most accounting systems organize by department because that is how budgets are approved. Turning department costs into per-customer costs is an allocation exercise with judgment inside it.
Unit economics tools for 2027, by name
The tools below are grouped by how far each carries the join on its own and what it leaves you to do. None chooses your unit for you. That decision stays yours.
NetSuite (Oracle). ERP with revenue recognition built to ASC 606. Performance obligations and contract modifications sit in the same system as the invoice. Suits publishers and franchises past a few million in revenue who need one record from contract to recognized revenue. Pricing is quoted per module and user, not published.
Sage Intacct. Mid-market accounting with strong dimensional reporting. That makes per-customer cost allocation possible without a second warehouse. Suits SaaS and franchise operators with a controller who will own the definitions. Quoted annually, module-based.
Xero. Small-business ledger with a clean API and a wide app market. Suits marketplaces and independent publishers under a few million who will do the join in a spreadsheet or a BI layer. Published monthly tiers, per organization.
Looker (Google Cloud). Modeling layer where cohort and allocation logic is written once and reused. A measure means the same thing everywhere. Suits teams with an analyst who can maintain LookML. Quoted annually, platform plus user seats.
Mode. SQL-first analytics with shareable reports and version history. Suits operators who already keep a clean warehouse and want the cohort view without a modeling project. Published tiers plus a quoted enterprise plan.
Preset (hosted Apache Superset). Open-source BI you can self-host. The spend-to-cost join stays inside your own perimeter. Suits teams with engineering time and data-residency constraints. Free self-hosted, paid cloud tiers.
ProfitWell Metrics (Paddle). Subscription analytics that computes churn, expansion and cohort retention from billing data out of the box. Suits SaaS on recurring billing whose unit is the subscriber. Free tier, paid plans published.
Baremetrics. Subscription dashboards and forecasting on top of Stripe, Recurly and similar processors. Suits small SaaS that wants the cohort view without building it. Published monthly tiers by revenue band.
ChartMogul. Subscription analytics with cohort segmentation and dunning, plus an API for the join you still own. Suits SaaS and membership publishers. Published tiers by tracked revenue.
Causal and Runway. Modeling tools where the assumptions block is the product. Versions are kept rather than overwritten. Suit operators who want the restatement test built in. Both published tiers, both quoted above them.
Most of these tools fail the full spend-to-cost join because they cover one link well and leave the other four to you.
Why the dashboard usually cannot answer this
Reporting tools aggregate: totals, averages, trends by period. Unit economics needs three things that fit that model badly.
It needs cohorts, every record tied to arrival and followed forward, so a pattern is not read as a finding. That grouping is the subject of MIT's data mining course.
It needs allocation, a rule assigning shared costs to units, which is a decision rather than a query. And it needs definitions that travel, since a measure computed one way in the dashboard and another in the finance model is two measures with one name, the trap set out in business model types metrics.
A dashboard displays the result once the model exists. Expecting it to produce the model is the most common tooling mistake here.
The allocation question no tool answers
Which costs a unit caused is a judgment, and it is yours. The test: what would not have been spent if that unit had never existed? Applying it means arguing about support, infrastructure, payment fees and refunds one at a time.
Those arguments are the substance of unit economics. The split between a cost caused and one assigned is central to MIT's financial and managerial accounting course.
A tool can apply your rule consistently. It can show which rule it applied and let you change it to see what moves. It must not choose for you silently. If you cannot find where a system decided a cost was fixed rather than variable, treat its output as an estimate of unknown quality.
What to require of anything you buy
Five requirements, all testable in an evaluation.
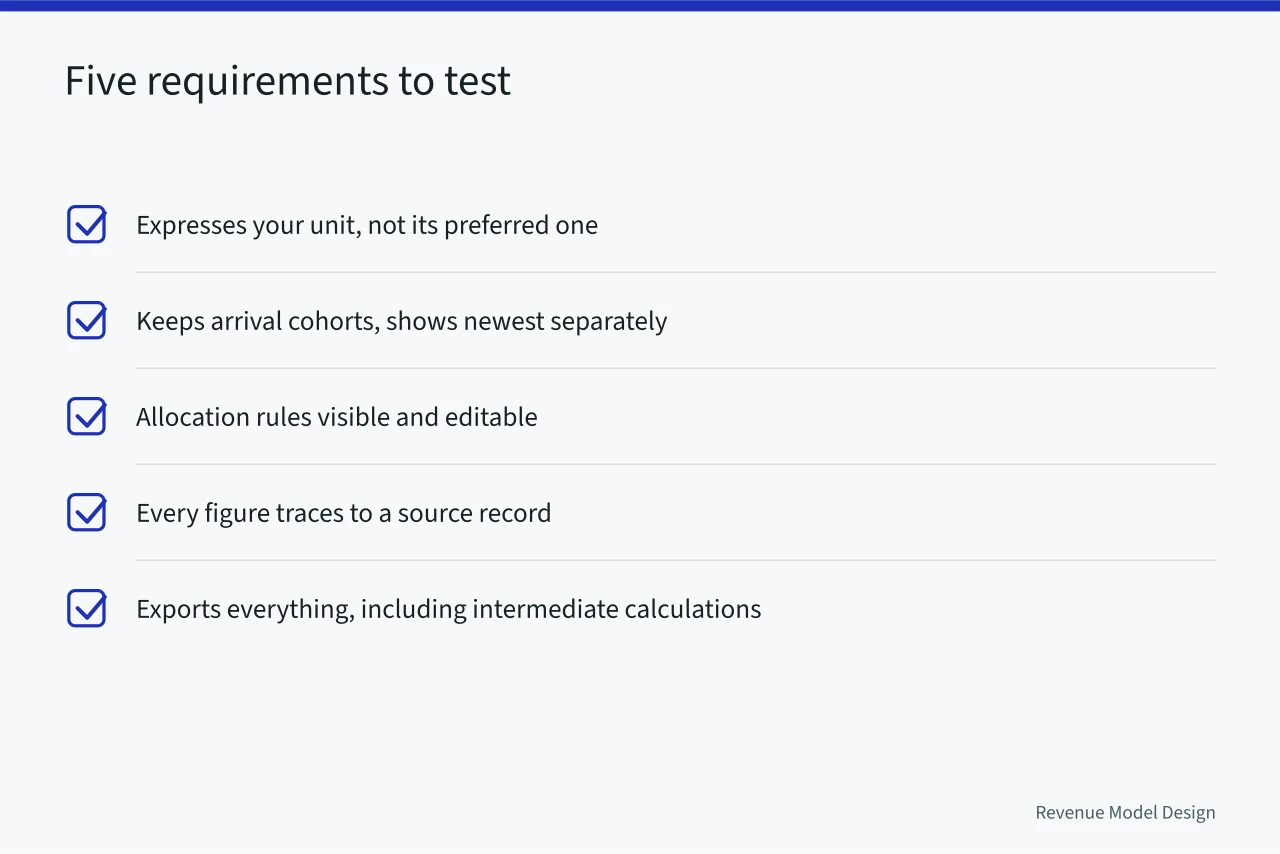
Ask for those demonstrated on your own data with a real account. The gap between the demonstration and the sample is usually the join problem, appearing at last.
Common questions
When is a spreadsheet no longer enough?
When more than one person maintains it, when the source data no longer fits, or when a mistake would be invisible. Those are the triggers, not company size.
Should the model live with finance or the operating team?
One owner, whoever it is, with definitions written where both can read them. Two models in two places is the reliable way to have two answers. Naming the owner belongs with the other standing decisions on the business model types checklist.
How often should it be recomputed?
Often enough that the newest cohort is visible while you can still act on it, and no more often than the underlying data changes. Monthly suits most businesses.
Does any of this change how we should charge?
Sometimes, and that is the point. A model showing which customers cost most to serve is an argument about your billing metric. That is a question for the revenue models overview before it is a question for the spreadsheet.