Guides
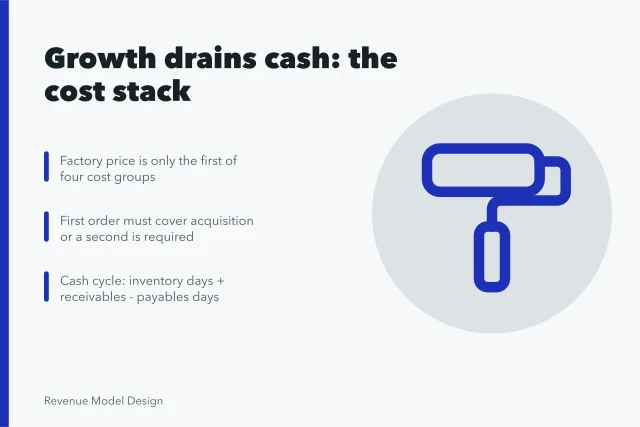
Part of Why growth quietly drains cash in most product models
Product models tools compared: what the demo will not show you
Product modeling tools compared by what they store: unit cost, list and realized price, deductions, and the export test that decides a purchase.
Product models tools compared by what they store, not by the demo. A demo shows a clean price list and a chart that goes up. It will not show the account on a four-year-old arrangement, the freight allowance booked in an account the sales record never meets, or the export button that produces a file nobody can open.
This page names specific tools, says what each one holds, and gives the arithmetic that tells you whether any of them can answer a pricing question about your book. The comparison uses five tests: unit cost, list price, realized price, deductions, and export.
What to take away
- A pricing tool is only as good as its worst join: price record to cost record to shipment record. Most systems hold two of the three well.
- Realized price is collected cash divided by units shipped. If your system cannot reproduce last quarter's figure, it is a reporting tool.
- Deductions booked away from the sales record make list and realized price look identical when they are several points apart.
- Ask for the full export in the demo, open it, and try to rebuild one month of margin from it.
- Below a few hundred products, a versioned spreadsheet with a source note on every input beats a dashboard nobody can reconstruct.
Product models tools compared: ProfitWell, Maxio, Tackle.io, Stripe, NetSuite, Excel, Looker and Pricefx
The table compares what each named tool is built to hold. A billing system can be strong and still hold no unit cost. The notes give the public pricing shape and the buyer each tool fits.
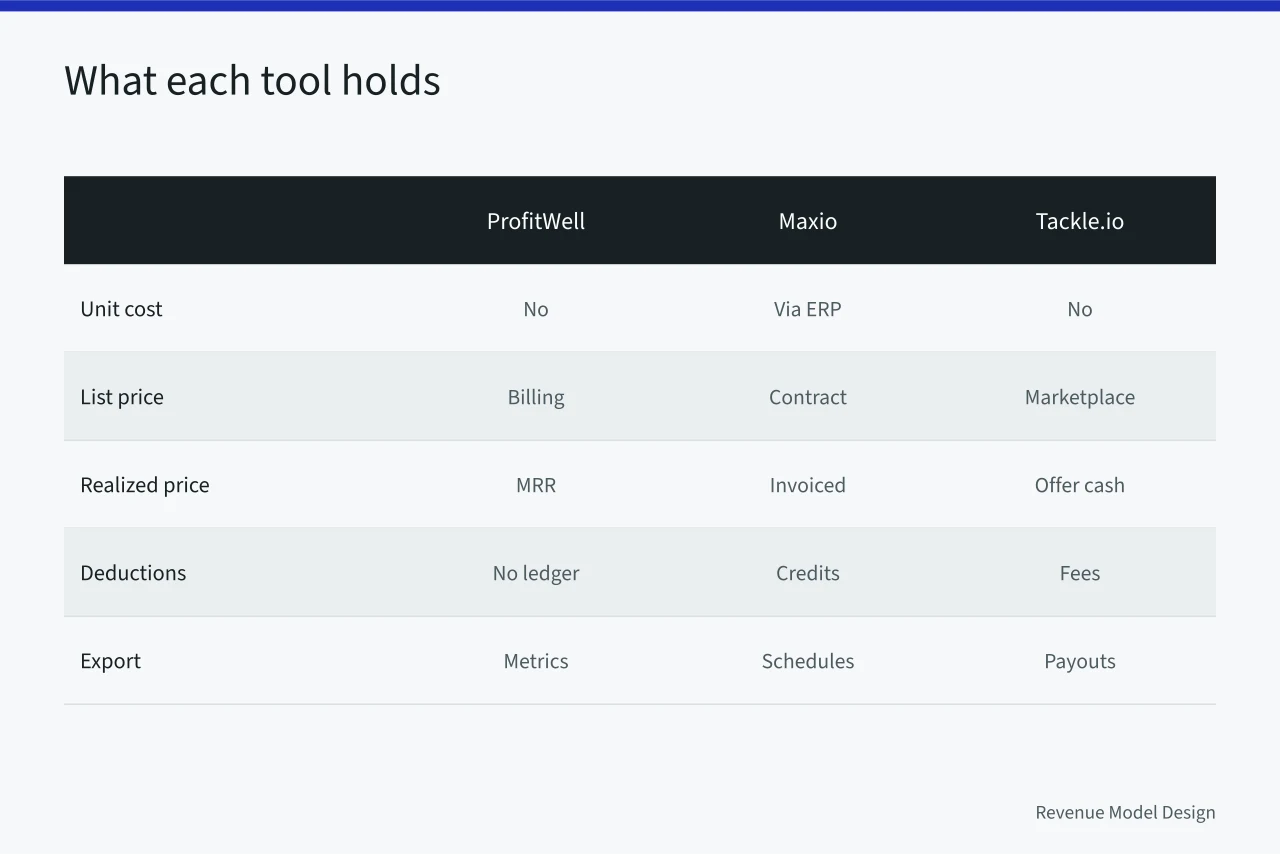
| Tool | Unit cost | List price | Realized price | Deductions | Export |
|---|---|---|---|---|---|
| ProfitWell Metrics (Paddle) | No native cost ledger | Subscription list via billing | MRR, churn and expansion | Not a deductions ledger | Metrics export, not a ledger rebuild |
| Maxio | Via ERP or accounting | Contract price | Invoiced revenue and schedules | Contract credits and modifications | Revenue schedules and invoices |
| Tackle.io | No | Marketplace list | Private offer cash | Marketplace fees and payouts | Offer and payout records |
| Stripe Billing and Stripe Tax | No | Metered and tiered list | Collected billing volume | Credits, refunds and tax lines | Billing and tax exports |
| NetSuite and Sage Intacct | Dated cost records | Sales order price | Revenue and cash | Credits, returns and allowances | Ledger and transaction export |
| Microsoft Excel or Google Sheets | You define it | You define it | You calculate it | You model it | File export, version history depends on drive |
| Looker and Metabase | Warehouse dependent | Warehouse dependent | Warehouse dependent | Warehouse dependent | Query results and scheduled exports |
| Pricefx, PROS and Vendavo | Via integration | Price lists and segments | Deal and invoice price | Exception and approval records | Price and deal exports |
ProfitWell Metrics (Paddle). Subscription revenue analytics that sits on top of a billing system and reports MRR, churn and expansion. It suits SaaS teams whose revenue is already in Stripe or a comparable processor. Pricing is free for the core metrics product, with paid tiers for retention tooling.
Maxio (formerly SaaSOptics plus Chargify). Billing and revenue operations for B2B subscription books, including contract modifications and revenue schedules. It suits finance teams that need ASC 606 schedules alongside invoicing. Quote-based pricing; expect a five-figure annual contract at scale.
Tackle.io. Marketplace and cloud co-sell operations, tracking private offers and the cash that settles through AWS, Azure and Google Cloud. It suits software firms selling through hyperscaler marketplaces. Subscription pricing, quoted by deal volume.
Stripe Billing and Stripe Tax. Metered and tiered billing with tax determination built in. It suits product-led businesses that want billing and payment in one place. Transaction-based pricing, a percentage plus a per-transaction fee.
NetSuite and Sage Intacct. Full ERP and accounting suites that hold dated costs, inventory and revenue in one ledger. They suit firms where the cost record and the sales record must be the same record. Annual license plus implementation, often six figures.
Microsoft Excel or Google Sheets. Still the fastest place to compute contribution margin per unit when every input has a source note and the file is versioned. Free or bundled. The versioning discipline is the whole cost.
Looker and Metabase. Business intelligence layers that query whatever warehouse you already have. They suit teams with clean source data and a question that repeats monthly. Metabase is open source with a free tier; Looker is quoted per seat.
Pricefx, PROS and Vendavo. Enterprise price management and optimization, handling approval workflows, exception registers and guided selling. They suit manufacturers and distributors with thousands of SKUs and negotiated pricing. Annual license, typically six figures, with implementation on top.
None of these decide which costs belong in the unit. That is the framework in pricing architecture, and the cost reasoning sits in unit economics.
The join, and why it breaks
Realized price is collected cash divided by units shipped. Three systems have to agree on what a unit is: the price list, the shipping record, and the ledger. They usually do not, because each was built for a different purpose.
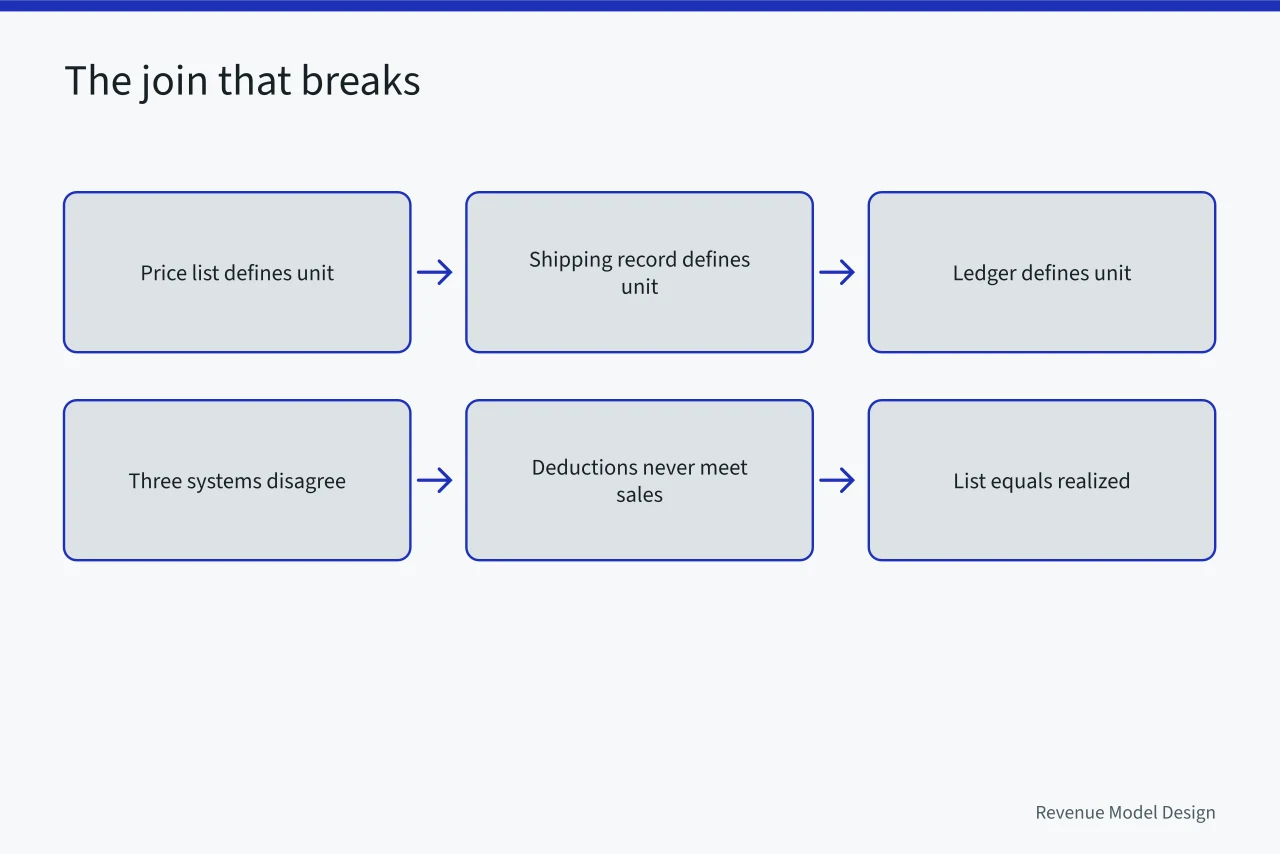
Deductions are the classic failure. Promotional credits, freight allowances and returns land in accounts that never meet the sales record. List price and realized price then look identical.
On a book where list is 100 and deductions run to eight, a forty point margin has lost a fifth of itself. Nothing in the reporting says so.
Fixing this is a definition exercise before it is a software one. The distinction between what a cost is and where it is recorded is the ordinary subject of managerial accounting, and MIT's financial and managerial accounting course shows the split done properly.
When a spreadsheet is genuinely enough
For most firms below a few hundred products, it is, on three conditions.
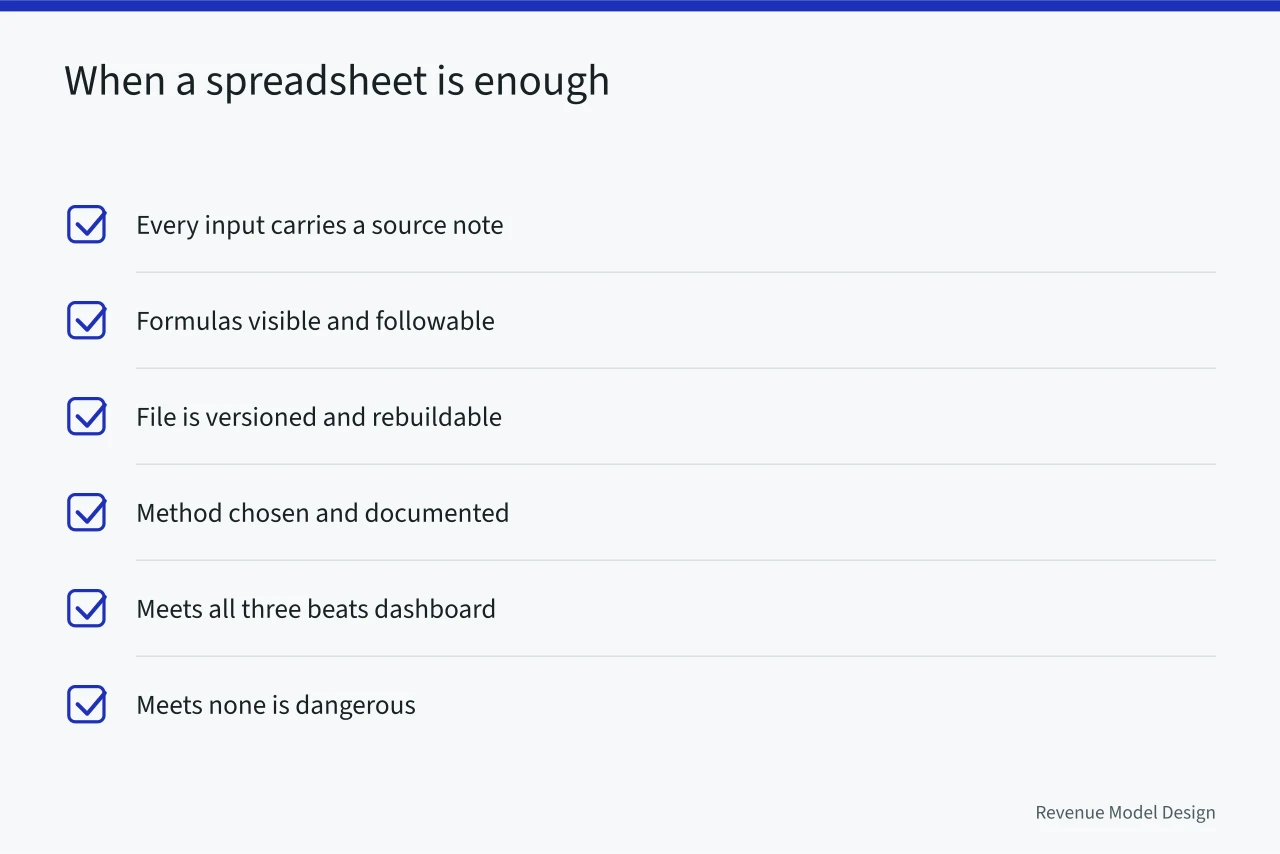
A spreadsheet meeting those three beats a purchased dashboard that meets none. A spreadsheet meeting none of them is the most dangerous file in the company, because its output looks the same either way.
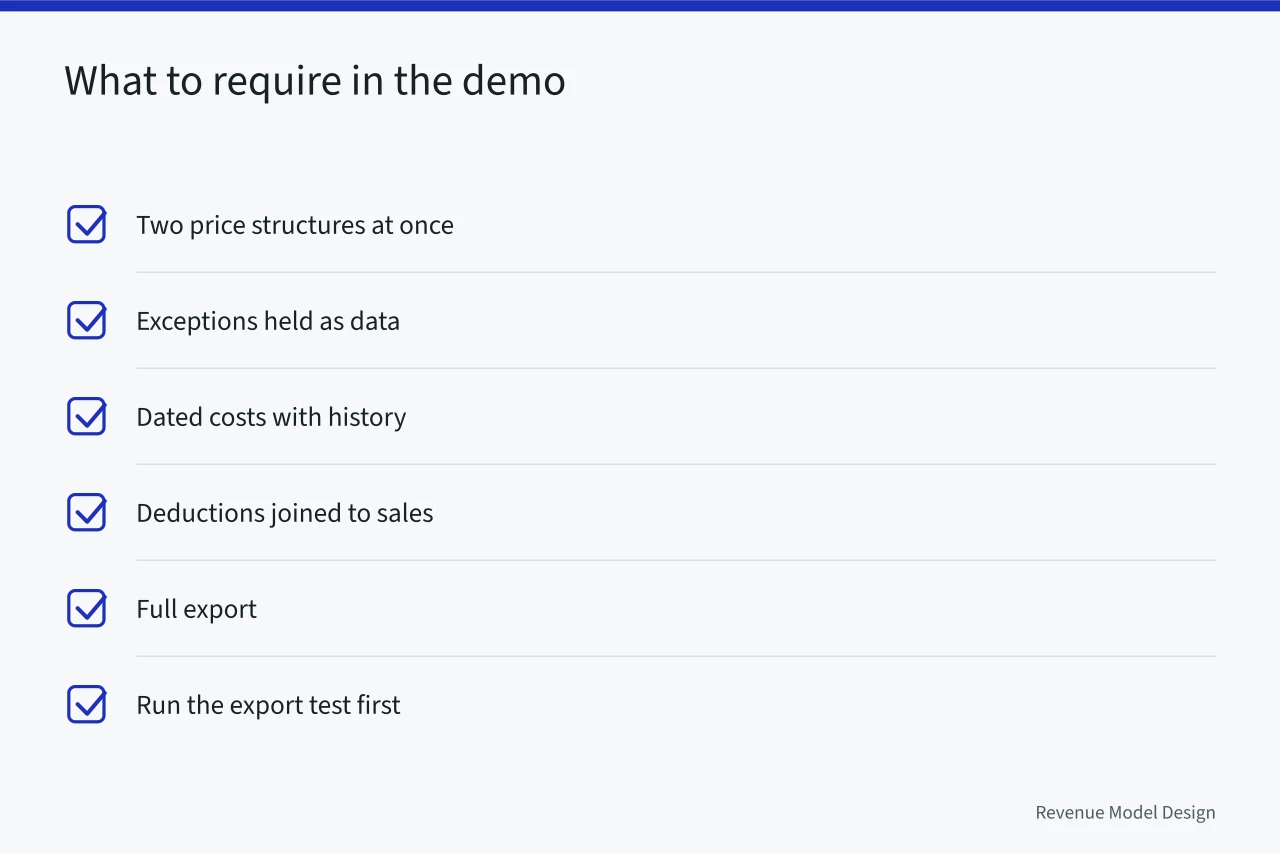
What to require in the demo
| Requirement | Why it matters | How to test it |
|---|---|---|
| Two price structures at once | You cannot migrate customers otherwise | Ask them to model an increase for new accounts only |
| Exceptions held as data | An exception in a comment field is invisible | Ask for every account off standard terms |
| Dated costs with history | Margin history is unreadable without them | Ask for contribution in a named past month |
| Deductions joined to sales | This is where realized price hides | Ask for realized against list by channel |
| Full export | You will leave one day | Ask for the export and open it |
Run the export test first. A system whose data you cannot get out will make your next decision for you.
What no tool fixes
None of them decide which costs belong in the unit, what the buyer's alternative is worth, or who may approve a discount. Those are the pricing decisions, and they live in the framework above.
A tool will not tell you that your list price is a fiction. Only the share of units sold at full price does, and you can compute that share this afternoon.
What the answer means for the shape of the business is in product models. Whether the shape itself should change is a model innovation question.
Common questions
Should we buy something before we have clean definitions?
No. A system installed on unresolved definitions produces confident wrong numbers faster. Settle what a unit is and what sits in the cost first; the software choice gets cheaper afterward.
How much of this can accounting software already do?
More than most firms use. Before evaluating anything new, ask your finance team to attempt the realized price calculation in what you already own. The attempt is informative even when it fails.
What about tools that recommend a price?
Treat any recommendation as a hypothesis with an assumption set behind it. Ask what data it used and what it assumes about your buyers. A recommendation you cannot interrogate is one you cannot defend in a negotiation.
We have three hundred products and no cost data. Where do we start?
With the twenty that carry most of the revenue. Get their costs dated and sourced, compute realized price against list, and act on what that shows. Completeness across three hundred is a year of work; the first twenty answer most of the question.