
Industry
Part of Which five decisions decide your business model type?
Business model types metrics explained for people who act on them
Business model types metrics do not travel between structures: which family fits which shape of money, and the five definitional traps that break every comparison.
Metrics do not travel between model types. A measure that is central in one structure is meaningless or misleading in another. Importing one because it appeared in something you read is the most common way a dashboard ends up describing a business nobody runs.
There are no benchmark figures on this page, and the last section explains why that is a feature rather than an omission.
What to take away
- A metric is useful when it tracks the shape of the money.
- A metric definition that survives a handover has six parts.
- A short list that survives every structure, because they are about the business rather than the shape of the revenue.
The rule
A metric is useful when it tracks the shape of the money. For recurring revenue, the measures track survival and expansion over time. For transactional revenue, they track the value and frequency of transactions.
Where capacity is sold, they track how much was used and at what effective price. Where inventory is involved, they track how fast cash completes the round trip.
Apply the wrong family and you get a number that moves for reasons unconnected to anything you can act on.
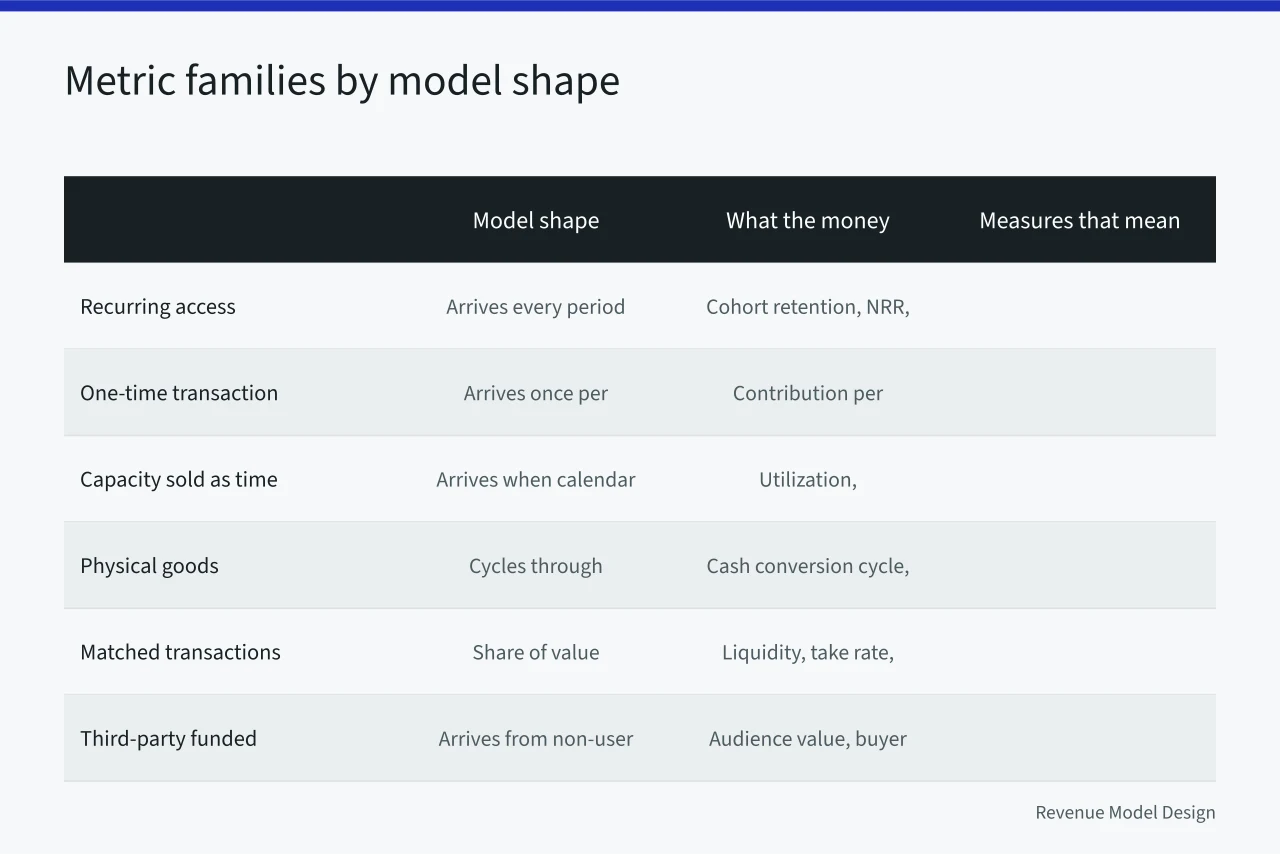
| Model shape | What the money does | The measures that mean something |
|---|---|---|
| Recurring access | Arrives every period until it stops | Cohort retention, net revenue retention, contraction, involuntary churn |
| One-time transaction | Arrives once per purchase | Contribution per order, repeat purchase rate, time to second order |
| Capacity sold as time | Arrives only when the calendar is filled | Utilization, realization, effective rate per engagement |
| Physical goods | Cycles through inventory and back | Cash conversion cycle, sell-through, return rate, inventory aging |
| Matched transactions | Arrives as a share of value transacted | Liquidity by slice, take rate, leakage, repeat pairs |
| Third-party funded | Arrives from someone other than the user | Audience value per period, concentration of buyers, delivery cost per free user |
Two things that look transferable and are not. Churn is meaningless in a one-time transaction business, where the equivalent question is repeat purchase and its timing.
Utilization is meaningless where delivery does not consume a calendar. Chasing it in a product business produces overtime rather than revenue. Why a binding resource decides throughput, and why measuring anything else changes nothing, is set out in MIT's introduction to operations management, and the business version of the same constraint is in service models.
The five definitional traps
The same metric name computed two ways gives two different answers, and both are defended sincerely. These are the disagreements worth settling in writing before anyone reports a number.
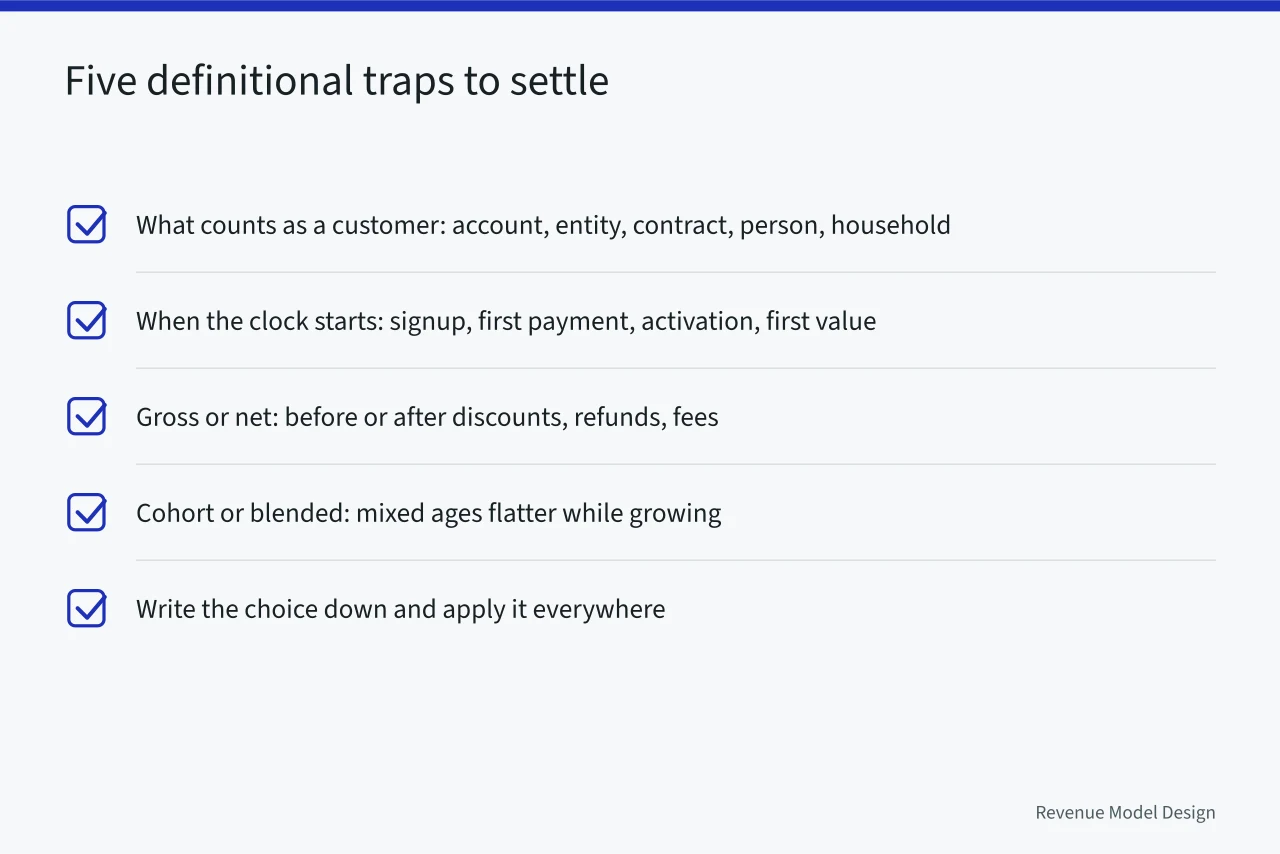
What counts as a customer. An account, a paying entity, a contract, a person, or a household. A company with several business units may be one customer or six, and retention swings wildly depending on which. Pick one, write it down, and apply it everywhere.
When the clock starts. Signup, first payment, activation, or first delivered value. Retention measured from signup and retention measured from first real use are different numbers about different populations, and the gap between them is one of the more informative things you can look at.
Gross or net. Revenue before or after discounts, refunds, channel fees, and pass-through costs. Churn counted as lost customers or as lost revenue. A business can have low customer churn and high revenue churn at the same time, which means the customers leaving are the large ones. What counts as receipts before any of this is computed has rules behind it, stated plainly for a small business in IRS Publication 334.
Cohort or blended. A blended figure mixes populations of different ages, and while you are growing, the young ones dominate and flatter everything. Any retention or repeat-purchase number that is not cut by arrival cohort is a statement about your growth rate as much as about your customers.
Which period, and aligned to what. Calendar months, subscription months, and rolling windows produce different answers, and comparisons across teams break silently when two of them are in use.
Writing a definition somebody else can reproduce
A metric definition that survives a handover has six parts. It fits in a paragraph and it prevents most of the arguments above.
- Name and formula. The exact numerator and denominator, written as arithmetic.
- Population. Who is included and, more importantly, who is excluded: trials, internal accounts, test data, one specific enormous customer.
- Period. The window, and what it is aligned to.
- Source. The system the values come from, and what happens when two systems disagree.
- Owner. The person who recomputes it and answers questions about it.
- The decision it changes. If nobody can name an action that would differ depending on the value, the metric is decoration and should be retired.
That last one removes more numbers from a dashboard than any other discipline available, and none of them are missed.
The four that apply regardless of model
A short list that survives every structure, because they are about the business rather than the shape of the revenue.
Cash position and its direction. Not profit. Every model can be profitable and insolvent, and the routes differ but the ending does not.
Contribution after the costs the unit caused. Whatever your unit is, the money left after the costs that would not have been spent without it. Everything else in a model argument is downstream of this number, and how to compute it is the whole of unit economics.
Concentration. The share of revenue depending on your largest few customers, your largest channel, and your largest supplier. Three separate numbers, usually different, and the largest is your real exposure.
Cost to serve, distributed rather than averaged. The spread across customers matters more than the mean, because the mean hides both the accounts subsidizing everyone else and the ones being subsidized.
Why there are no reference figures here
You will find plenty of published averages for the measures above. They are close to useless for a specific decision, for three reasons.
The definitions differ. Two sources reporting the same metric name are frequently computing different things, and the methodology, where it is stated at all, rarely says which of the five traps above it fell into.
The populations differ. A figure drawn from a set of companies at a particular scale, in a particular market, at a particular moment, describes that set. Your business is not in it.
And the direction of causation is unclear. A published figure describes what some companies achieved, not what is achievable in your circumstances. Using it as a target replaces a judgment about your own business with a judgment about somebody else's.
The productive use of an external figure is narrow: it prompts you to ask why yours differs. If your number is far from a published one, find out whether the definition differs, the population differs, or the business genuinely differs. All three answers are useful.
Treating it as a target is how a team spends a year optimizing toward a number that was never about them.
Where to start
Take the row from the table above that matches how your money actually arrives. Write proper definitions for those three or four measures using the six-part format. Compute them by cohort and by segment from the beginning, because retrofitting a cohort view onto data that was only ever aggregated is expensive and often impossible.
Then add the four universal measures, and stop. A short list of well-defined numbers that someone owns beats a long list that nobody can reproduce.
The structural background to why the measures differ by type is in the business model types framework, and the wider comparison of the types sits in the business model types overview.
Common questions
Can we run two metric families at once?
If you genuinely run two businesses, yes, reported separately and never blended. A single dashboard mixing a recurring family with a transactional one produces numbers that move for reasons nobody can act on.
What if our shape is changing?
Keep both sets during the transition, labeled, and read the new-structure cohort separately. A blended figure in month three of a change is a mixture of two businesses and reports neither.
Who should write the definitions?
Whoever will have to answer questions about the number. A definition written by someone who never recomputes it does not survive its first disagreement.
How many measures is too many?
More than you can name a decision for. The six-part format above ends with the decision the metric changes, and that field retires more numbers than any other discipline available.